|
Incident Graphs |
  
|
|
Incident Graphs |
|
Summary
Ingenious Software has designed a handful graphs to offer alternatives ways to report incident's statistics.
Graph reports are accessed with the graph icon (![]() ) in the List Button Bar.
) in the List Button Bar.
Graphed Reports
The available graphs are possible:
This graph can get a little crowded in a large list. Often we will have several responses where we only did one of a certain type. Grouping single responses together will help greatly in displaying meaningful data. Opens the Graph Parameters and Grouping window.
Totals by Hour:
This graph will provide the incidents by time of day.
This graph will take the same numbers and group them by the response type categories, instead of individual response types.
This graph splits the incidents up between the different occupancy types that the incidents occurred
This graph provides the number of incidents per year, for comparison.
For multi-station departments this graph will illustrate the number of the selected Incidents that each station attended.
Usage
There is often a large list of incidents with a variety of data. Often this can lead to far too many categories to be graphed effectively. We can merge several categories together to free up some space. See Manual Grouping (below)
The lists to the left show the categories of results.
The drop list of available graph types will show:
Bar --> 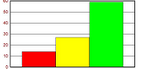
Pie --> 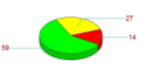
Ring --> 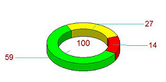
3-D --> 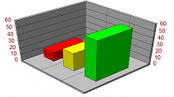
The item name is a field that allows the user to change the item names for graphing purposes.
When Create Graph is clicked, a JPG is generated of the graphing results.
This file can be saved to a destination of your choice on your computer.
The item name is a field that allows the user to change the item names for graphing purposes.
Manual Grouping
Most of the time auto-group option works best for grouping smaller items together. The minimum number is put in automatically and selecting the 'Group' button and the optimum # of categories is built. The Grouping to the right will gather up any results that are less than the value given in the 'Minimum Number' field and group them all together as a category labeled by the user. Clicking reset will restore the graph to the way it was at creation time.
There is the option to manually group items them together. However, this is a little bit of a tricky combination of control clicks:
Hold control down and highlight each of the items you want to group. Take your fingers off the control key.
Click and hold on one of the highlighted items.
Press down on the control key again and drag the items to the final list item you wish to group these items with.
See Also